Link:
- Word Doc of Lab Report Format
- Rubric For Grading
Dallara, Spring 2012
Integrated Science 3-4
Laboratory Report Format
Laboratory Report Format
Written Format Labs we do in Integrated Science 3-4 will generally follow this format. In addition, certain labs will require you to complete a formal written lab report. You should follow the format below in completing lab write-ups. Use the Experimental Design and Rules of Graphing that follow for additional help.
A. Title A brief statement that summarizes the experiment’s purpose. This should be indicated at the top of the page in the center.
B. Introduction/ Purpose Describe the background, rationale, and purpose of your experimental investigation. If appropriate for the assignment, incorporate and cite information from your literature review. Use these questions to guide you:
D. Materials and Procedure (Experimental Design)
Step-by-step, specify how the experiment was conducted. Methods should be written with enough detail and clarity for someone to repeat the experiment.
E. Data/Results Include:
F. Discussion This should be a written summary of your data (from above). The focus of the discussion, should be on the interpretation of those results, especially trends and anomalies.
A standard format is detailed below:
First, write a topic sentence (or sentences), which reminds the reader of the purpose for the experiment (stating the effect of the independent variable on the dependent variable).
Second, describe the data and its reliability with references to actual data tables and graphs. Do this by stating and comparing the calculated values for central tendency and variation (using the appropriate descriptive statistics) between IV levels.
Third, offer reasons/explanations for patterns that are observed in the data. An experiment may produce results that meet the expectations (support the hypothesis) or it may produce results that do not meet the expectation (do no support the hypothesis). Provide explanations and speculations for both types of results – expected and unexpected. Carefully examine the experimental design, considering the effects of all constants, controls and variables. Include a critique of the experimental procedures, that is, the manner in which the experimental design was actually implemented.
Finally, describe how the data supports or refutes the hypothesis. Compare the findings with other researchers and the “real world”. Offer recommendations both for improving the experiment and for further study.
G. Conclusion Briefly restate the purpose of your study, the major findings and how your data support your conclusion(s). Was your hypothesis confirmed by the experiment? If so, discuss the reasons behind your observed phenomena. If the data do not confirm your hypothesis, briefly explain why this may have been the case.
Written Format Labs we do in Integrated Science 3-4 will generally follow this format. In addition, certain labs will require you to complete a formal written lab report. You should follow the format below in completing lab write-ups. Use the Experimental Design and Rules of Graphing that follow for additional help.
A. Title A brief statement that summarizes the experiment’s purpose. This should be indicated at the top of the page in the center.
B. Introduction/ Purpose Describe the background, rationale, and purpose of your experimental investigation. If appropriate for the assignment, incorporate and cite information from your literature review. Use these questions to guide you:
- What do you already know? What is the relevant scientific information and research? (Background)
- Why are you conducting the experiment? (Rationale)
- What do you hope to learn? (Purpose: a concise statement of the problem undergoing investigation)
- Re-state purpose/problem,
- Use “if,....then” statement to predict outcome, if possible.
- Based on prior observation and research, explain why you made this prediction.
D. Materials and Procedure (Experimental Design)
Step-by-step, specify how the experiment was conducted. Methods should be written with enough detail and clarity for someone to repeat the experiment.
- List all materials used.
- Follow Experimental Design Worksheet to isolate an independent variable, design multiple treatments of the variable, establish a control and constants, and specify dependent variable(s).
E. Data/Results Include:
- Qualitative Data: Observations, notes, labeled drawings, etc.
- Quantitative Data: Numbers, measurements, etc. compiled on Data Tables. Graphs should be used to further organize quantitative data (see Rules of Graphing). Include statistical analysis, percent error, if appropriate.
F. Discussion This should be a written summary of your data (from above). The focus of the discussion, should be on the interpretation of those results, especially trends and anomalies.
- Answer any laboratory questions asked, analyze controls and variables, and provide specific data in support of your analysis.
- Compare your findings to other research (in class or literature) and propose explanations for discrepancies.
- Make suggestions for design and/or procedural improvements, and recommendations for further study.
- If the lab includes analysis questions, answer here using standard conventions of English composition.
A standard format is detailed below:
First, write a topic sentence (or sentences), which reminds the reader of the purpose for the experiment (stating the effect of the independent variable on the dependent variable).
Second, describe the data and its reliability with references to actual data tables and graphs. Do this by stating and comparing the calculated values for central tendency and variation (using the appropriate descriptive statistics) between IV levels.
Third, offer reasons/explanations for patterns that are observed in the data. An experiment may produce results that meet the expectations (support the hypothesis) or it may produce results that do not meet the expectation (do no support the hypothesis). Provide explanations and speculations for both types of results – expected and unexpected. Carefully examine the experimental design, considering the effects of all constants, controls and variables. Include a critique of the experimental procedures, that is, the manner in which the experimental design was actually implemented.
Finally, describe how the data supports or refutes the hypothesis. Compare the findings with other researchers and the “real world”. Offer recommendations both for improving the experiment and for further study.
G. Conclusion Briefly restate the purpose of your study, the major findings and how your data support your conclusion(s). Was your hypothesis confirmed by the experiment? If so, discuss the reasons behind your observed phenomena. If the data do not confirm your hypothesis, briefly explain why this may have been the case.
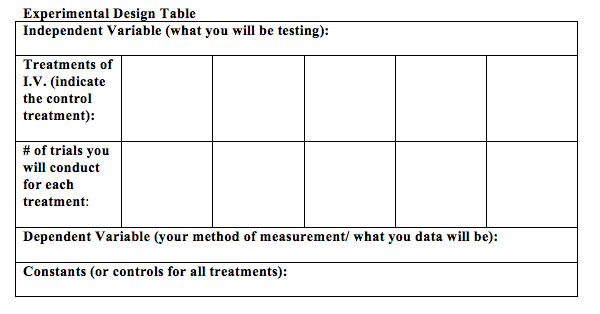
Dependent Variable (your method of measurement/ what you data will be):
Constants (or controls for all treatments):
Rules of Graphing:
1. Choose the appropriate type of graph. Use:
3. Designate axis:
5. Number the axis with appropriate scale and consistent increment increase. (Example: 2,4,6,8,10, etc. -- NOT: 2,3,6,7,13,27)
6. Title the graph with a title that reflects what the graph illustrates. Often a combination of the name of y-axis vs. name of x-axis works well. (Example “Growth vs. Time”).
7. Plot data correctly on graph. If multiple sets of data appear on graph, be sure to include a key. (Example: “Red=trial #1, Blue=trial#2”).
Constants (or controls for all treatments):
Rules of Graphing:
1. Choose the appropriate type of graph. Use:
- Bar graph for discontinuous data and histograms.
- Line graph for continuous data.
- Pie chart for percent of whole.
3. Designate axis:
- Use x-axis (horizontal) for independent data (what you knew before experiment, Example: time).
- Use y-axis (vertical) for dependent data (what you knew only after doing experiment, Example: growth).
- “y depends on x”
5. Number the axis with appropriate scale and consistent increment increase. (Example: 2,4,6,8,10, etc. -- NOT: 2,3,6,7,13,27)
6. Title the graph with a title that reflects what the graph illustrates. Often a combination of the name of y-axis vs. name of x-axis works well. (Example “Growth vs. Time”).
7. Plot data correctly on graph. If multiple sets of data appear on graph, be sure to include a key. (Example: “Red=trial #1, Blue=trial#2”).
